Nonlinear system analysis #
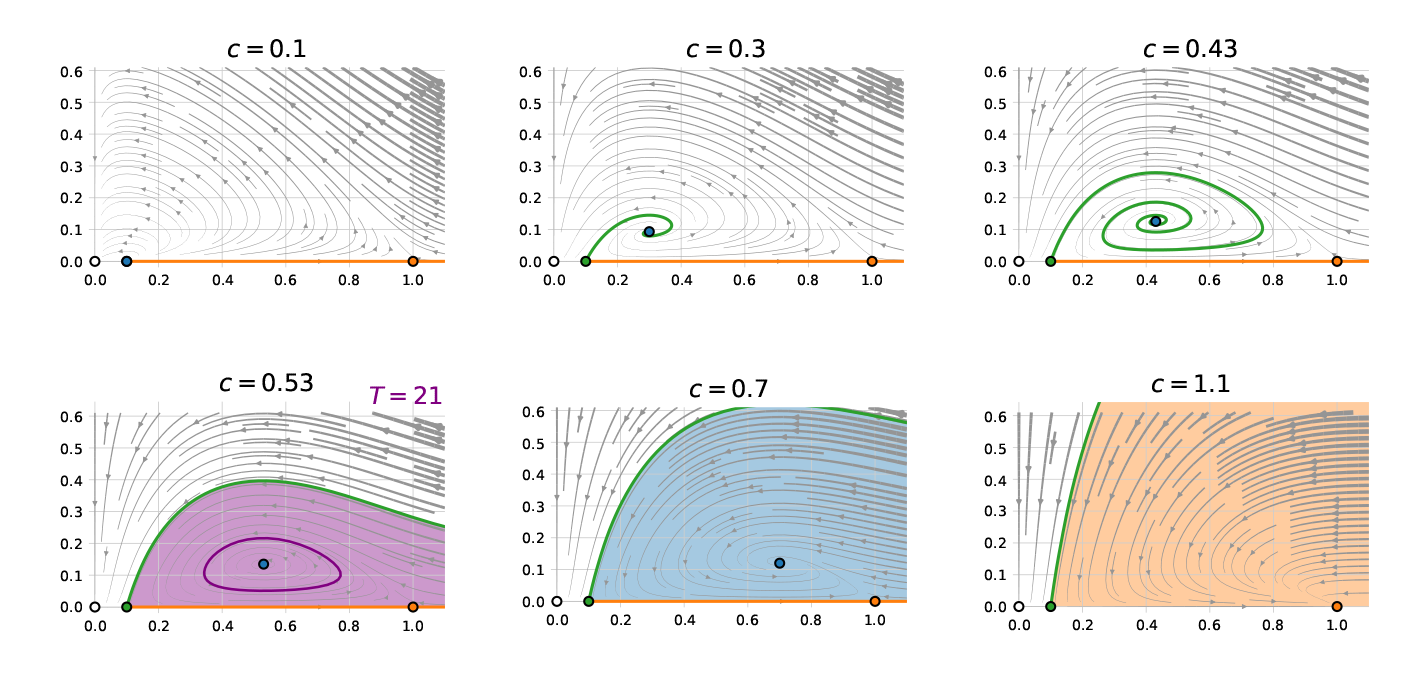
Coursework for my class on nonlinear dynamical systems & chaos. Read the report and the Jupyter notebooks on GitHub, or, for a quick overview, check out some captioned figures in the ReadMe.

Coursework for my class on nonlinear dynamical systems & chaos. Read the report and the Jupyter notebooks on GitHub, or, for a quick overview, check out some captioned figures in the ReadMe.
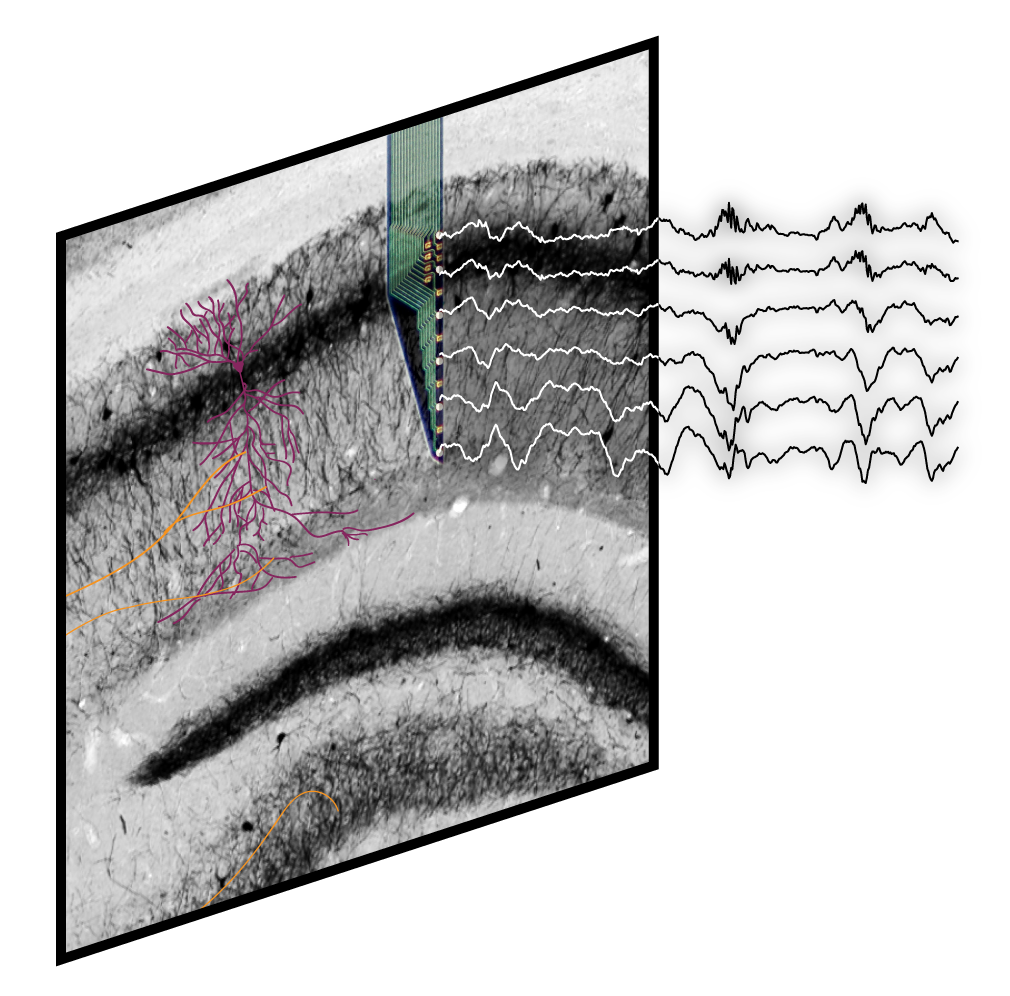
I had the opportunity to do my engineering master’s thesis in the lab of Fabian Kloosterman at NERF, where I was introduced to the wonderful world of neuroscience. The context and the goals of my thesis, and the current results, are shortly explained in this conference abstract. This poster, made at the beginning of the project, visually shows the setup and the initial plan. I developed a detection algorithm based on a gated recurrent neural network, yielding a significant improvement over the state of the art. (For the hippocampus connoisseurs: here are some preliminary detection results. Blue: state of the art method. Magenta: new method).

Machine learning and data analysis:
Neuroscience:
Misc and from core curriculum:
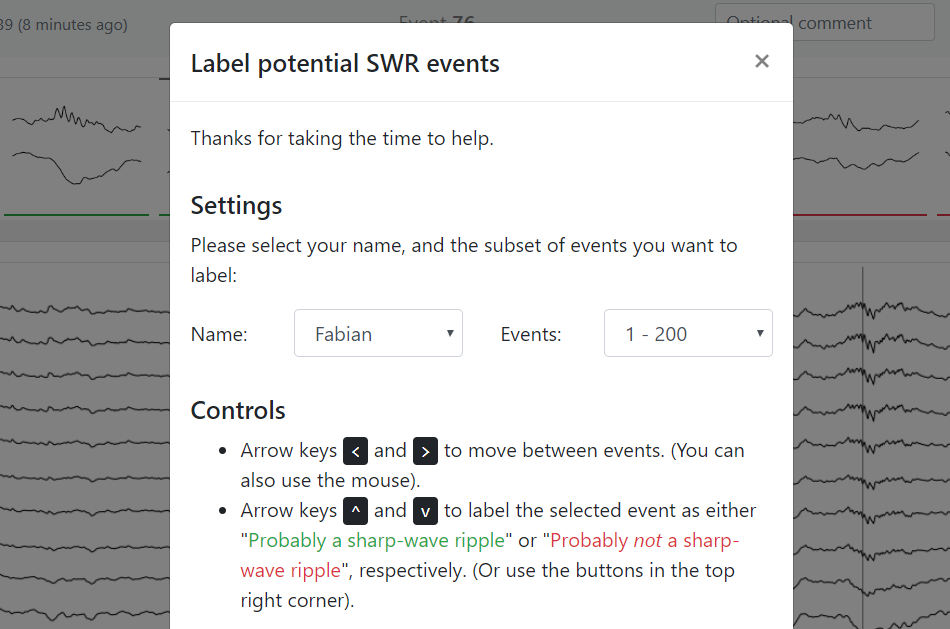
The signals I had to detect for my master’s thesis were not clearly defined – there is no ground truth for them. I therefore made a web interface for the neuroscientists in the lab, to label potential events. Tech: Vue.js, Node.js, mongodb, Bootstrap, Heroku, and the scientific Python stack for data processing and plot generation. GitHub repo’s for frontend, and backend.
⚠️ NOTE: the free service on which the backend was hosted has gone bankrupt; so the full interface won’t load anymore, alas.
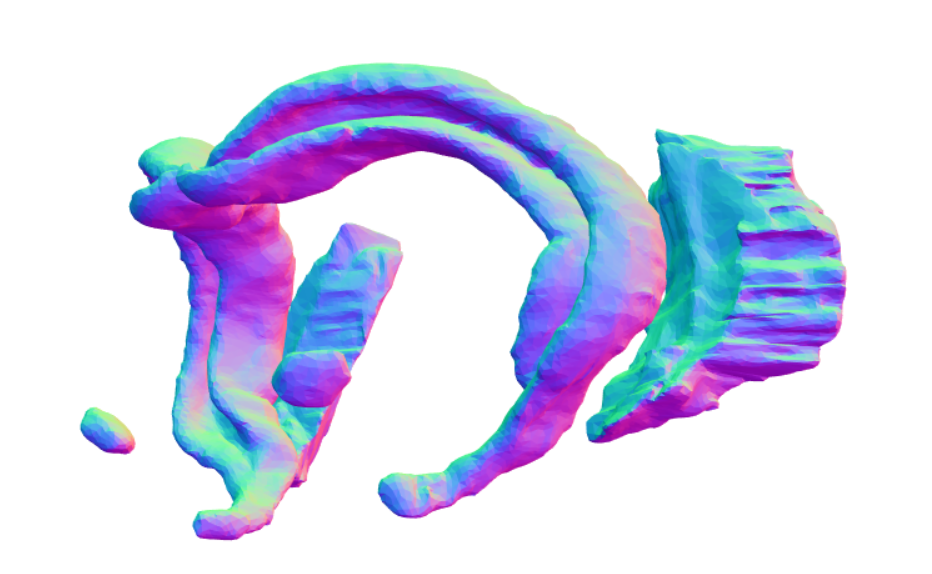
I wanted to learn about the gross neuroanatomy of the animals in the lab. Learning brain anatomy from books is not very useful though. Inspired by the great Allen Institute Brain Explorer for mice, I therefore made this interactive 3D visualisation of structures in the rat brain, based on open data. The GitHub repo explains how this data was processed. (Note: check out 3dBAR for another 3D rat brain atlas, with more features).
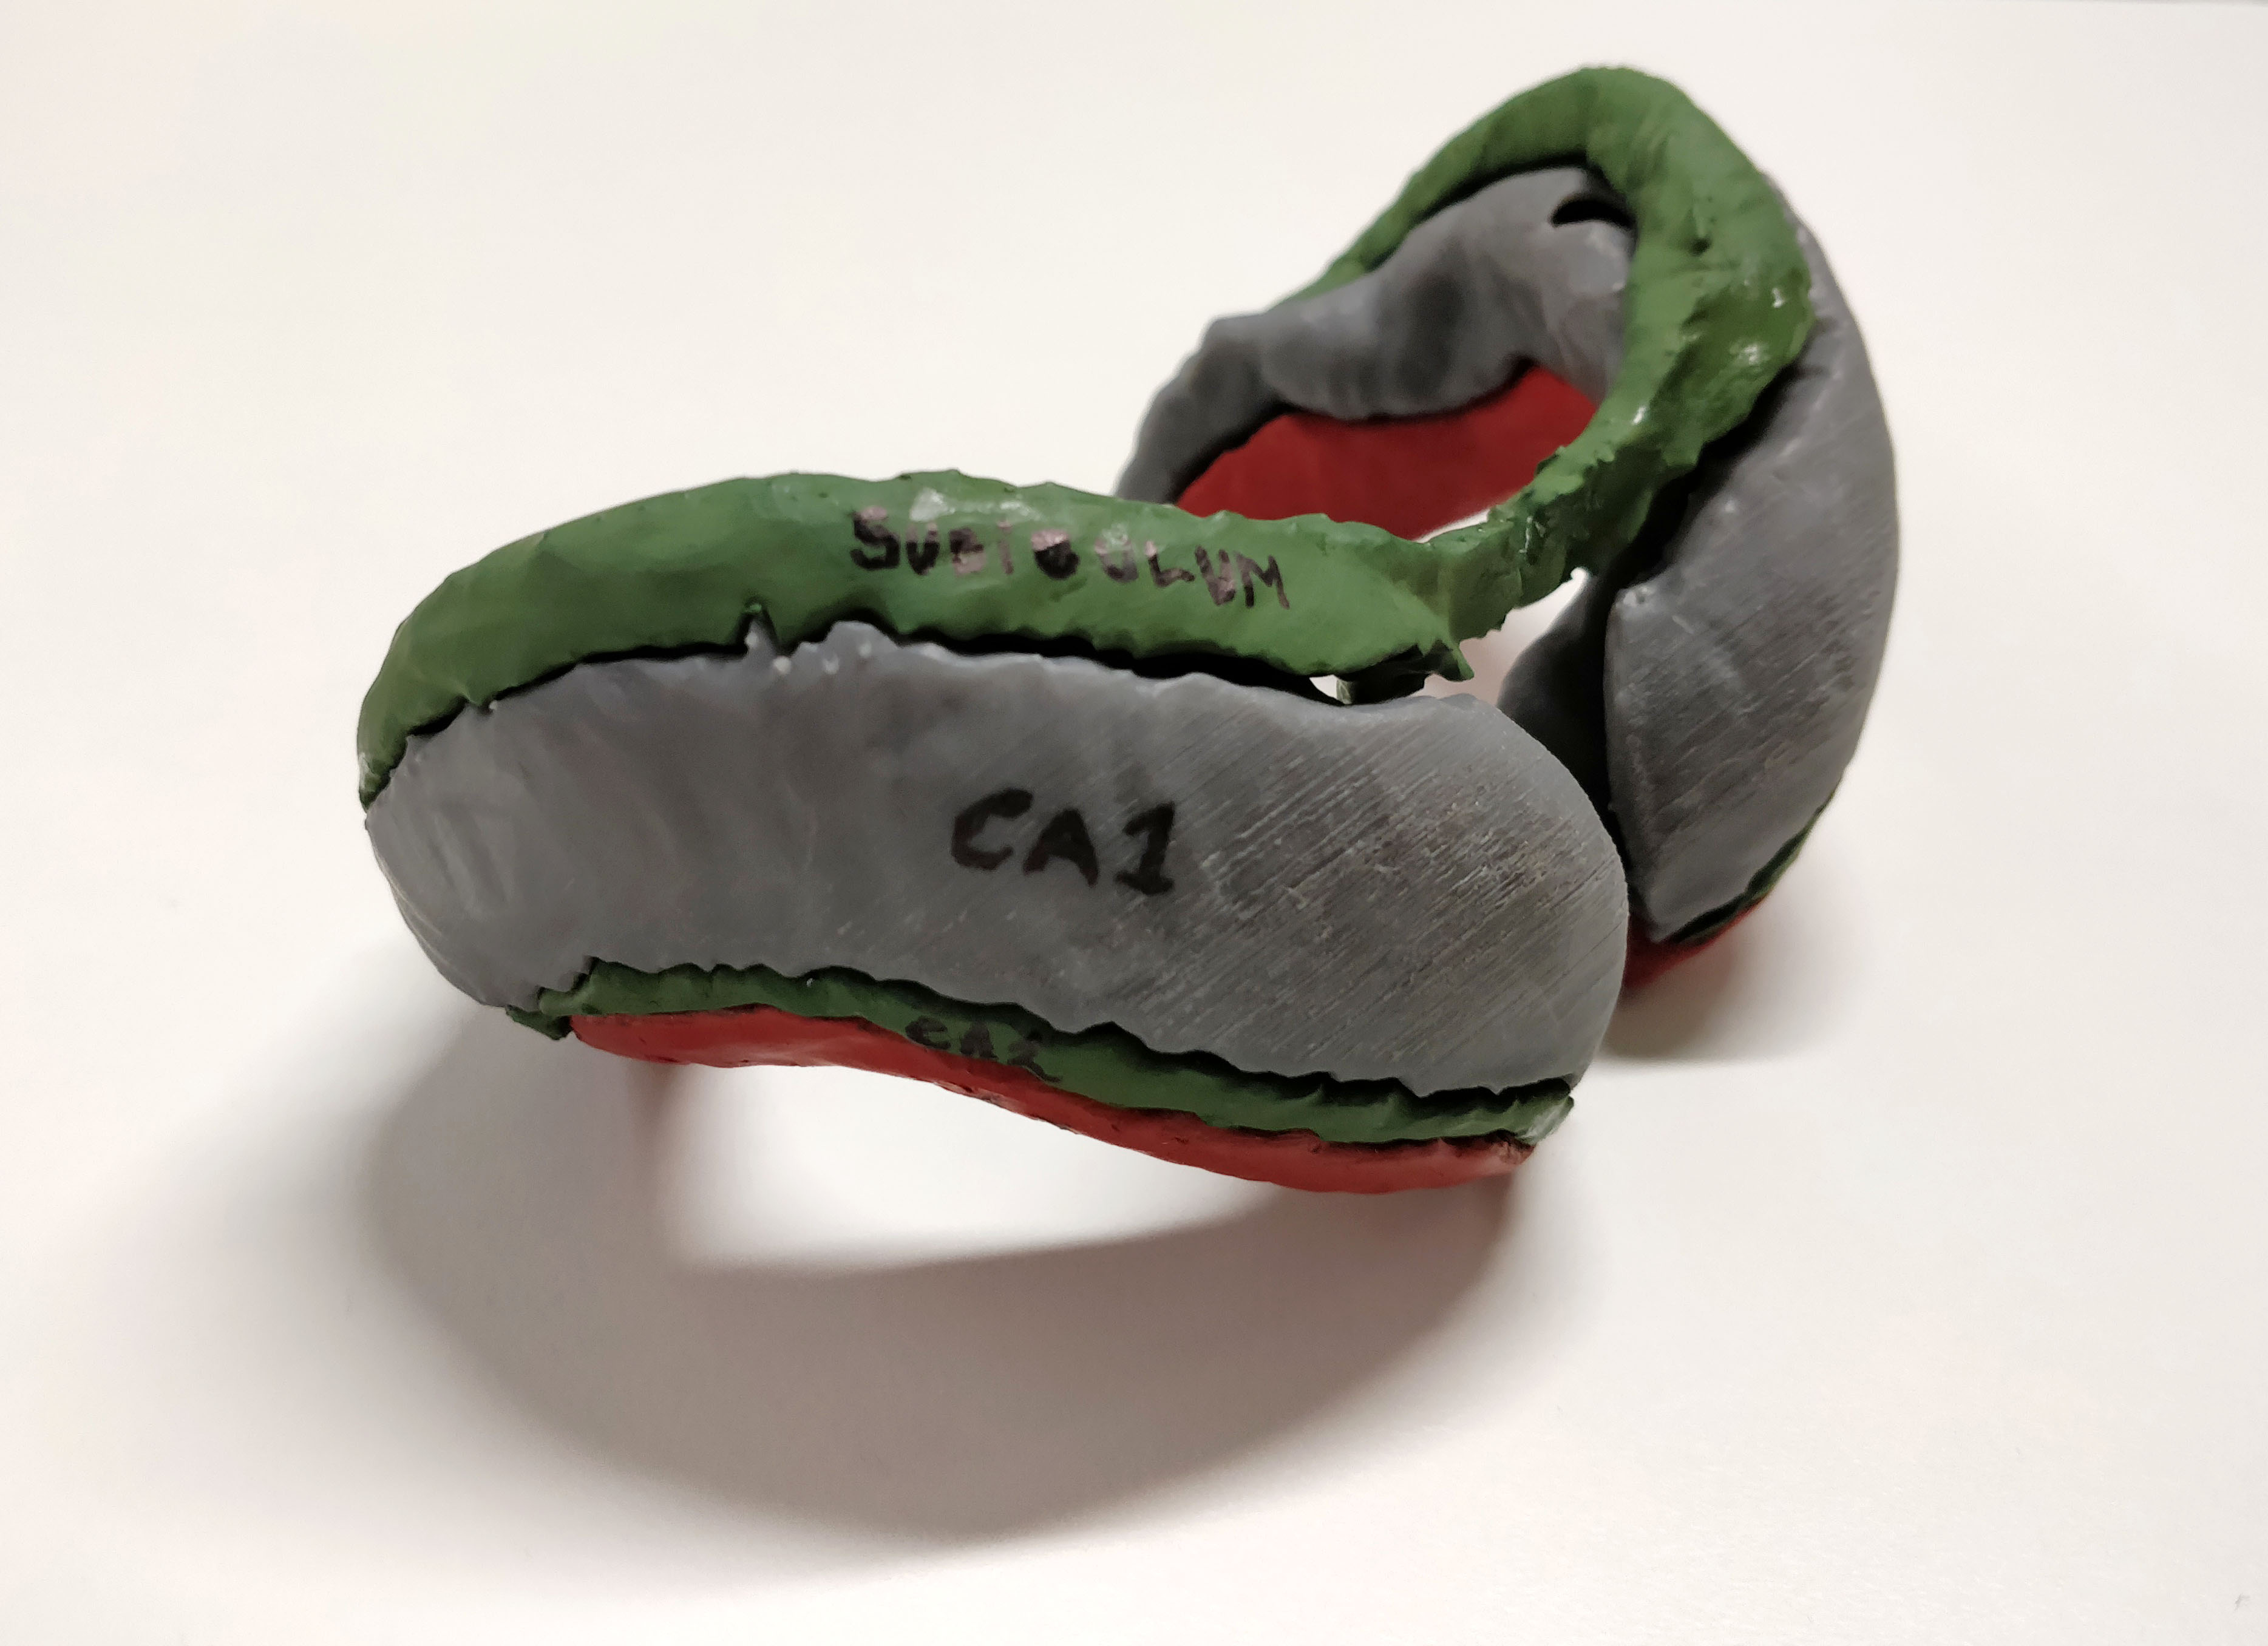
We have a Formlabs stereolithography 3D printer in the lab. So why not print some of the structures from the above 3D rat brain?
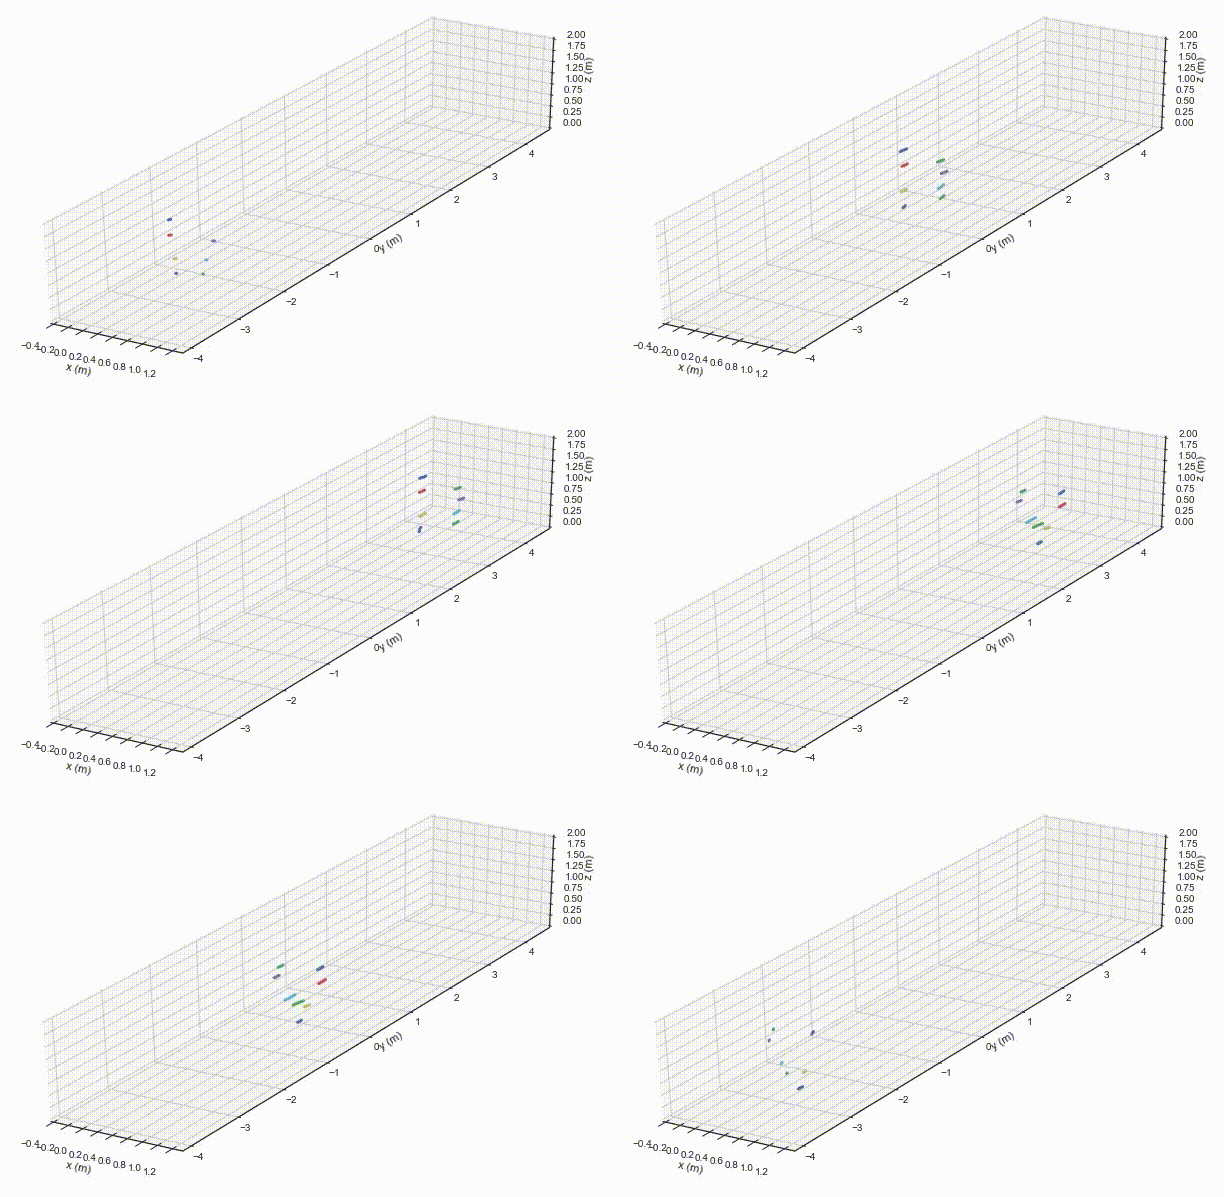
Byteflies makes medical wearables – small devices full of sensors that can be worn anywhere on the body. My job was to validate the signal quality of the motion sensors (accelerometer, gyroscope, and magnetometer) against the golden standard: motion capture. Read all about it in this blog post.
DataCamp makes online courses to learn ‘data science’ skills, via videos and interactive exercises. The DataCamp team wanted to know how long users spend in each exercise, and to have an internal API available that exposes this data, grouped and sliced by different dimensions. So that’s what I made, with the above high-level architecture.
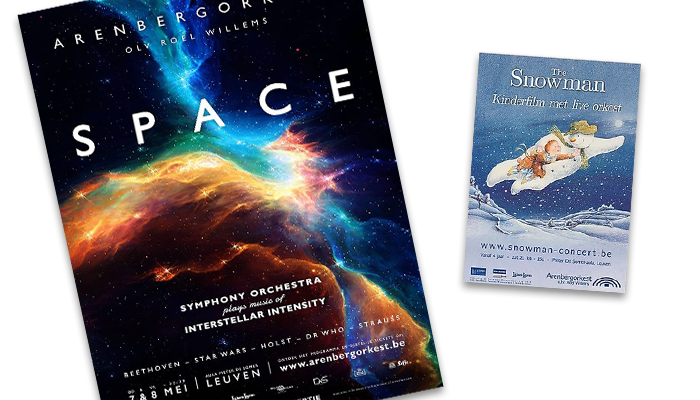
I did the poster typography and art selection for concerts with my symphony orchestra at the time (the lovely Arenbergorkest). For this orchestra I engaged myself in different roles: treasurer, IT, second violins section leader, and president during our concert tour in China.
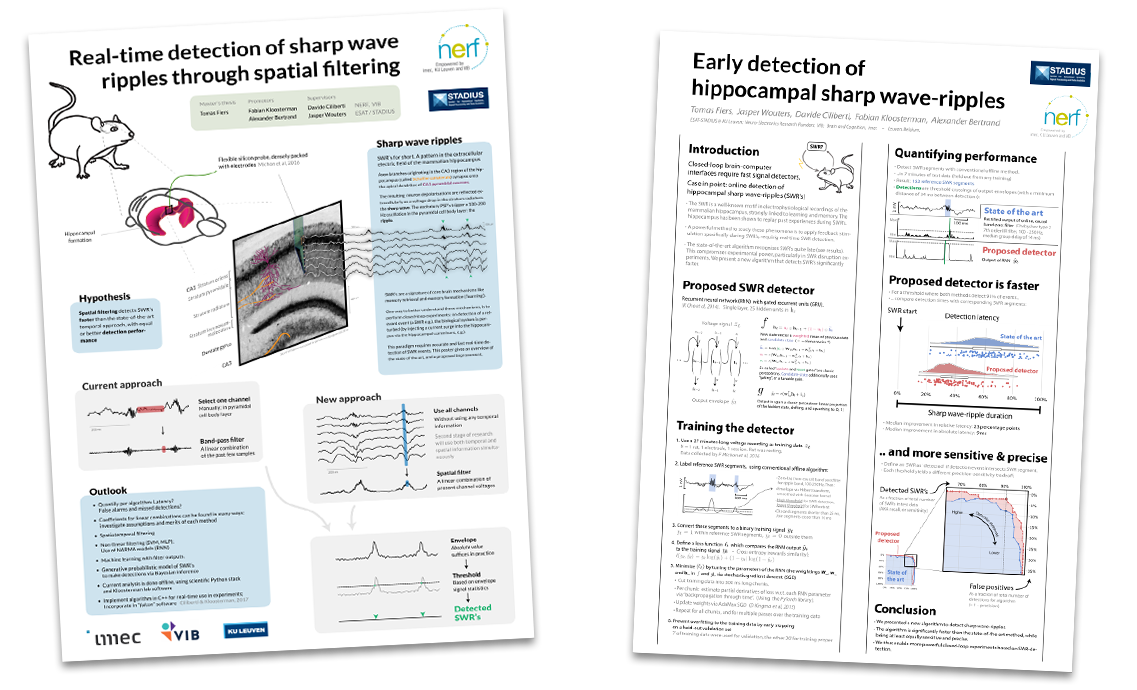
First poster made at the beginning of the master thesis, for the yearly NERF Retreat. Second poster made near the end of the thesis, for the Cell-NERF Symposium on Neurotechnologies.

I loved programming as a kid (still do and still am). Some of the hobby projects I remember: